

The National Institute for Communicable Diseases (NICD), a division of the National Health Laboratory Service, continues to provide laboratory-based surveillance to inform the public health response towards COVID-19 in South Africa.
Nationally we have exited the third wave according to the current definition. The national 7-day moving average of daily case numbers, positivity rate and testing rate continue to decrease, with sustained decreases seen in all provinces. Today the institute reports 1,634 new COVID-19 cases that have been identified in South Africa, which brings the total number of laboratory-confirmed cases to 2,895,976. This increase represents a 6.6% positivity rate.
As per the National Department of Health, a further 34 COVID-19 related deaths have been reported, bringing total fatalities to 87,001 to date. 17,553,515 tests have been conducted in both public and private sectors as per the table below.
| Sector | Total tested | New tested | ||
| PRIVATE | 9,470,096 | 54% | 10,597 | 43% |
| PUBLIC | 8,083,419 | 46% | 14,159 | 57% |
| Total | 17,553,515 | 24,756 | ||
PROVINCIAL BREAKDOWN
The majority of new cases today are from KwaZulu-Natal (21%), followed by Western Cape (18%). Northern Cape accounted for 16%; Eastern Cape accounted for 14%; Gauteng Province accounted for 12%; Free State accounted for 8%; Mpumalanga accounted for 5% and Limpopo accounted for 1% of today’s new cases. The cumulative number of cases by province is shown in the table below:
| Province | Total cases for 24 September 2021 | Adjusted numbers after harmonisation | Updated total cases on 24 September 2021 | New cases on 25 September 2021 | Total cases for 25 September 2021 | Percentage total |
| Eastern Cape | 289,350 | 0 | 289,350 | 232 | 289,582 | 10.0 |
| Free State | 160,453 | 0 | 160,453 | 131 | 160,584 | 5.5 |
| Gauteng | 915,326 | 0 | 915,326 | 201 | 915,527 | 31.6 |
| KwaZulu-Natal | 509,715 | 0 | 509,715 | 350 | 510,065 | 17.6 |
| Limpopo | 121,729 | 0 | 121,729 | 13 | 121,742 | 4.2 |
| Mpumalanga | 150,502 | 0 | 150,502 | 76 | 150,578 | 5.2 |
| North West | 149,027 | 0 | 149,027 | 73 | 149,100 | 5.1 |
| Northern Cape | 89,938 | 0 | 89,938 | 260 | 90,198 | 3.1 |
| Western Cape | 508,302 | 0 | 508,302 | 298 | 508,600 | 17.6 |
| Unknown | 0 | 0 | 0 | 0 | 0 | 0.0 |
| Total | 2,894,342 | 0 | 2,894,342 | 1,634 | 2,895,976 | 100.0 |
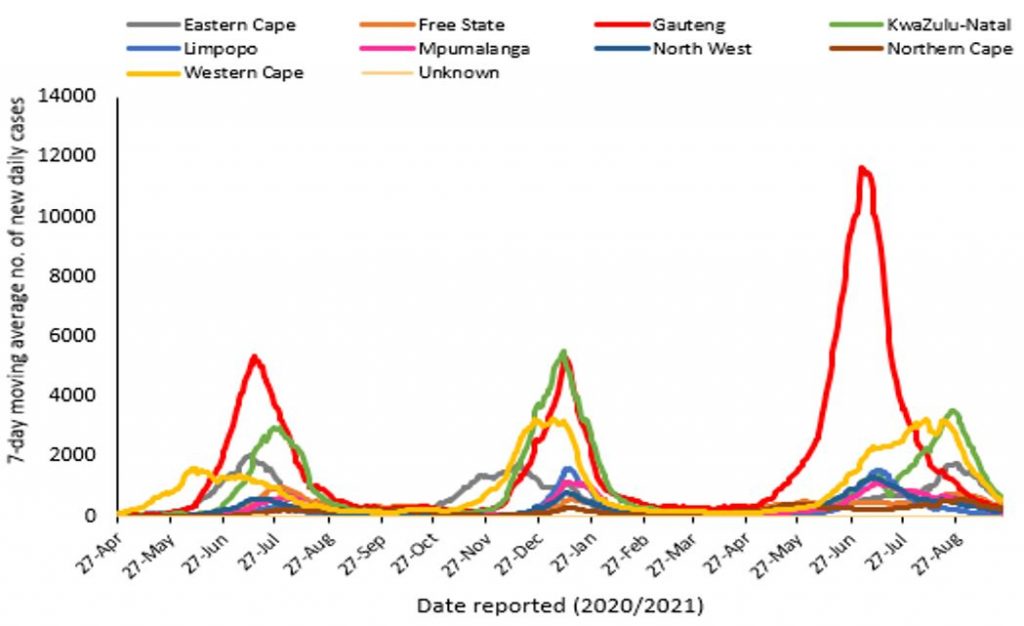
THE 7-DAY MOVING AVERAGE NUMBER OF NEW CASES BY PROVINCE
The total number of cases today (n= 1 634) is lower than yesterday (n= 2 261) and lower than the average number of new cases per day over the 7 preceding days (n= 2 232). The 7-day moving average daily number of cases has decreased.
For more detailed information, visit the GIS Dashboard.
HOSPITAL ADMISSIONS
There has been an increase of 57 hospital admissions in the past 24 hours. The following table is a summary of reported COVID-19 admissions by sector.
| Sector | Facilities Reporting | Admissions to Date |
Died to Date | Currently Admitted |
| Private | 258 | 198,238 | 36,453 | 3,639 |
| Public | 409 | 229,130 | 55,807 | 3,579 |
| TOTAL | 667 | 427,368 | 92,260 | 7,218 |
VACCINE UPDATE
For updates on the national vaccine programme, click here. Thank you for your interest and remember that adhering to preventative measures limits your risk of contracting and spreading COVID-19. For more information on COVID-19, click here.
Kind regards,
Sinenhlanhla Jimoh, Senior Communications Manager
National Institute for Communicable Diseases